
Identify and monitor retinal pathologies, towards a functional mapping of photoreceptors
How to monitor the health of photoreceptors in patients with retinal pathologies? Julia Granier, a doctoral student at the Institut de la Vision, shows in an article published last December in Biomedical Optics Express that optoretinography measured by AOSLO would be a formidable clinical tool for mapping retinal activity. Thanks to the introduction of a new metric, she managed to quantify the active cones and show the influence of parameters such as color blindness, the age of the patient and the location of the area studied. These results establish essential reference curves for the application of optoretinography in patients with retinal pathologies.
In the retina, you shouldn't trust appearances. Many retinal diseases impact photoreceptors, causing a loss of function without structural deformities visible with conventional imaging tools. As the observation of morphology alone is not sufficient to characterize the state of health of the retina, it is therefore necessary to take a direct interest in the functioning of photoreceptors.
The first is electroretinography, a global approach that measures the electrical response of the retina to a flash of light. However, in order to diagnose and monitor the evolution of pathologies that affect localized areas, such as AMD, or to measure the effectiveness of a treatment, it is necessary to be more precise by examining the response at the cellular level. This is what Julia Granier, a PhD student at the Institut de la Vision in Kate Grieve's team, is working on. She was interested in optoretinography, i.e. the measurement of the light trace left by cones (light-sensitive retinal cells) when they are activated. Implemented with an imaging system called AOSLO, this method allows it to track the activity of each cone in a given area, with cellular resolution. In her study, the young researcher presents a protocol for automatically distinguishing between active and non-active cones during imaging, as well as the evaluation of the influence of non-pathological factors.
The flickering of photoreceptors
Optoretinography is a retinal imaging technique that links the physiological response of photoreceptors to light excitation. It is based on the observation that following a flash of light, the cones of the retina begin to "flicker". These variations in light intensity are indicators of the activity of the cones, which makes them suitable biomarkers for monitoring the evolution of retinal pathologies.
The research team measures these flickers using adaptive optics-corrected scanning laser ophthalmoscopy (AOSLO), a high-resolution retinal imaging system. The measurement is divided into two stages: a first infrared illumination makes it possible to obtain a cell-level image of the photoreceptors of the retina, then the retina is illuminated for one second by a flash of green light to activate the light-sensitive cells. The cones are thus identified one by one and their variations in light intensity are measured over time.
Initial measurements showed that the cones responded very clearly to stimulation. However, in the case of diseases where the photoreceptors gradually stop working, it is necessary to determine at what light intensity the cones are considered inactive. The determination of a metric is then necessary to distinguish photoreceptors and automate the monitoring of pathologies for future clinical applications.
The implementation of the metric
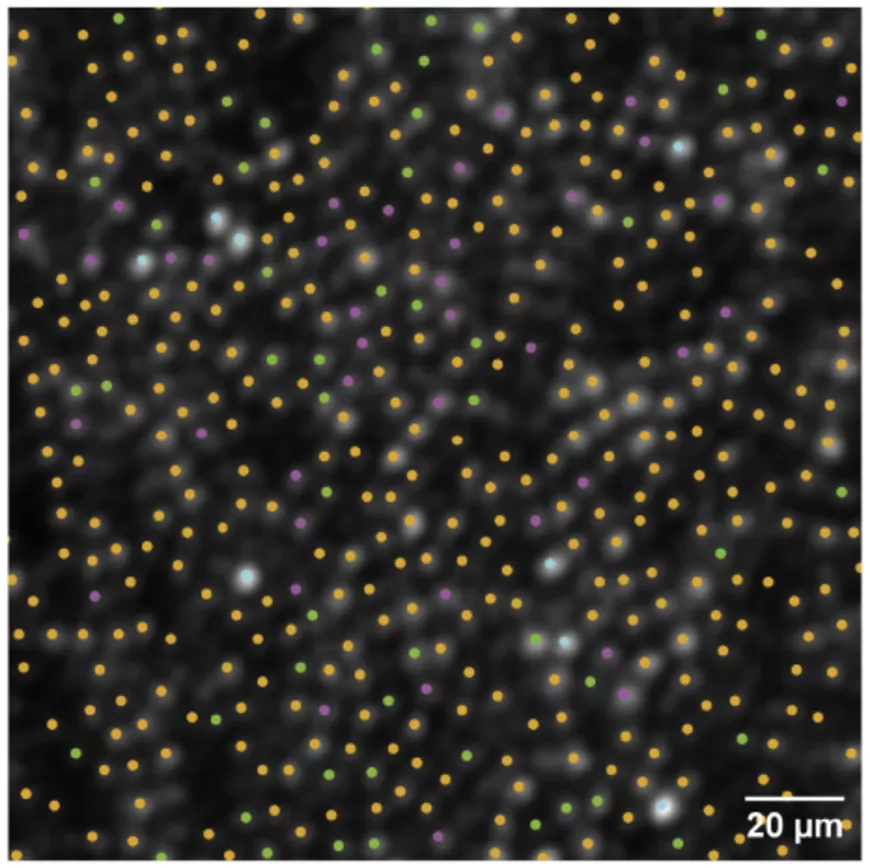
To distinguish the cones, the young researcher determined an upper and a low limit of intensity around an average intensity resulting from the control measures, i.e. without light stimuli. Cones, whose intensity is above and below these boundaries, are considered active. This new metric divides cones into two categories: those that respond strongly to light stimuli compared to the control measurement (active cones) and those that have a "neutral" response and have a light intensity similar to that of the control (inactive cones).
Thanks to this distinction, Julia Granier was able to map the distribution of active cones and observed in healthy patients that more than 80% of the cones responded to green light stimulation. This is consistent with the theoretical proportion of cones: the L and M cones are both sensitive to green light, unlike the 5 - 10% which correspond to the S cones and which are not sensitive to it.
Parameters to be taken into account in the mapping
This ability to distinguish cone activity raises the question of parameters that could influence the measurement in clinical applications.
The first parameter identified is related to a pathology: color blindness. Depending on the nature of the color blindness, some cones sensitive to green light will be deficient; The percentage of active cones will therefore vary. Measurements made in a dozen volunteers with three forms of color blindness confirmed this variation, which must be taken into account in the interpretation of functional mapping.
The other two non-pathological parameters are related to the age of the patients and the location of the inspected area on the retina.
After studying the retinas of 26 patients aged 22 to 83, the PhD student found that, in the elderly, the light intensity measured for active cones was lower and the photoreceptor response to the light stimulus was slower. These observations could be explained by a poorer absorption of light by the photoreceptors as well as by the anterior part of the eye, which would allow less light to pass through (decrease in the diameter of the pupil or yellowing of the lens).
Finally, the intensity measured also depends on the location of the imaged area: the further the area is from the fovea (the area of the retina located in the visual axis of the eye), the more the measured light intensity decreases and the slower the reaction. This decrease in reactivity and speed of response would be consistent with a structural variation of the cones: the length of their outer segment decreases with distance from the fovea.
Taking these parameters into account is necessary to make the diagnosis and monitoring of retinal pathologies effective in the clinic. To this end, the doctoral student proposes to set up tables that would indicate, for example, the expected light intensity according to the patient's age.
Clinically oriented research
Thus, although appearances are deceptive in the retina, AOSLO optoretinography circumvents this indeterminacy by providing a map of the distribution of active photoreceptors in the retina. By introducing a simple metric (percentage of responder cones) and an associated mapping, and by characterizing three major sources of interindividual variability (retinal eccentricity, color vision, age), this study proposes an essential frame of reference to interpret optoretinography signals in practice. It paves the way for more detailed functional monitoring of photoreceptors, in addition to structural imaging, to better understand and, ultimately, monitor the evolution of retinal pathologies.
Julia Granier's work is part of the research of the Direct Imaging of Cells and Patients team led by Kate Grieve at the Institut de la Vision, which is working on automating the detection of biomarkers of retinal pathologies and monitoring their evolution. Their activities are intimately linked to the Quinze-Vingts National Ophthalmology Hospital via the clinical investigation center. This unique collaboration between research engineers and clinicians significantly accelerates the introduction of new imaging techniques into clinical protocols.
Scientific article: Julia Granier, Elena Gofas Salas, and Kate Grieve, Influence of retinal eccentricity, color blindness, and age on optoretinography measured with AOSLO, Biomed. Opt. Express 16, 5332-5349 (2025)